DATA DEMO
Real data, not mockups
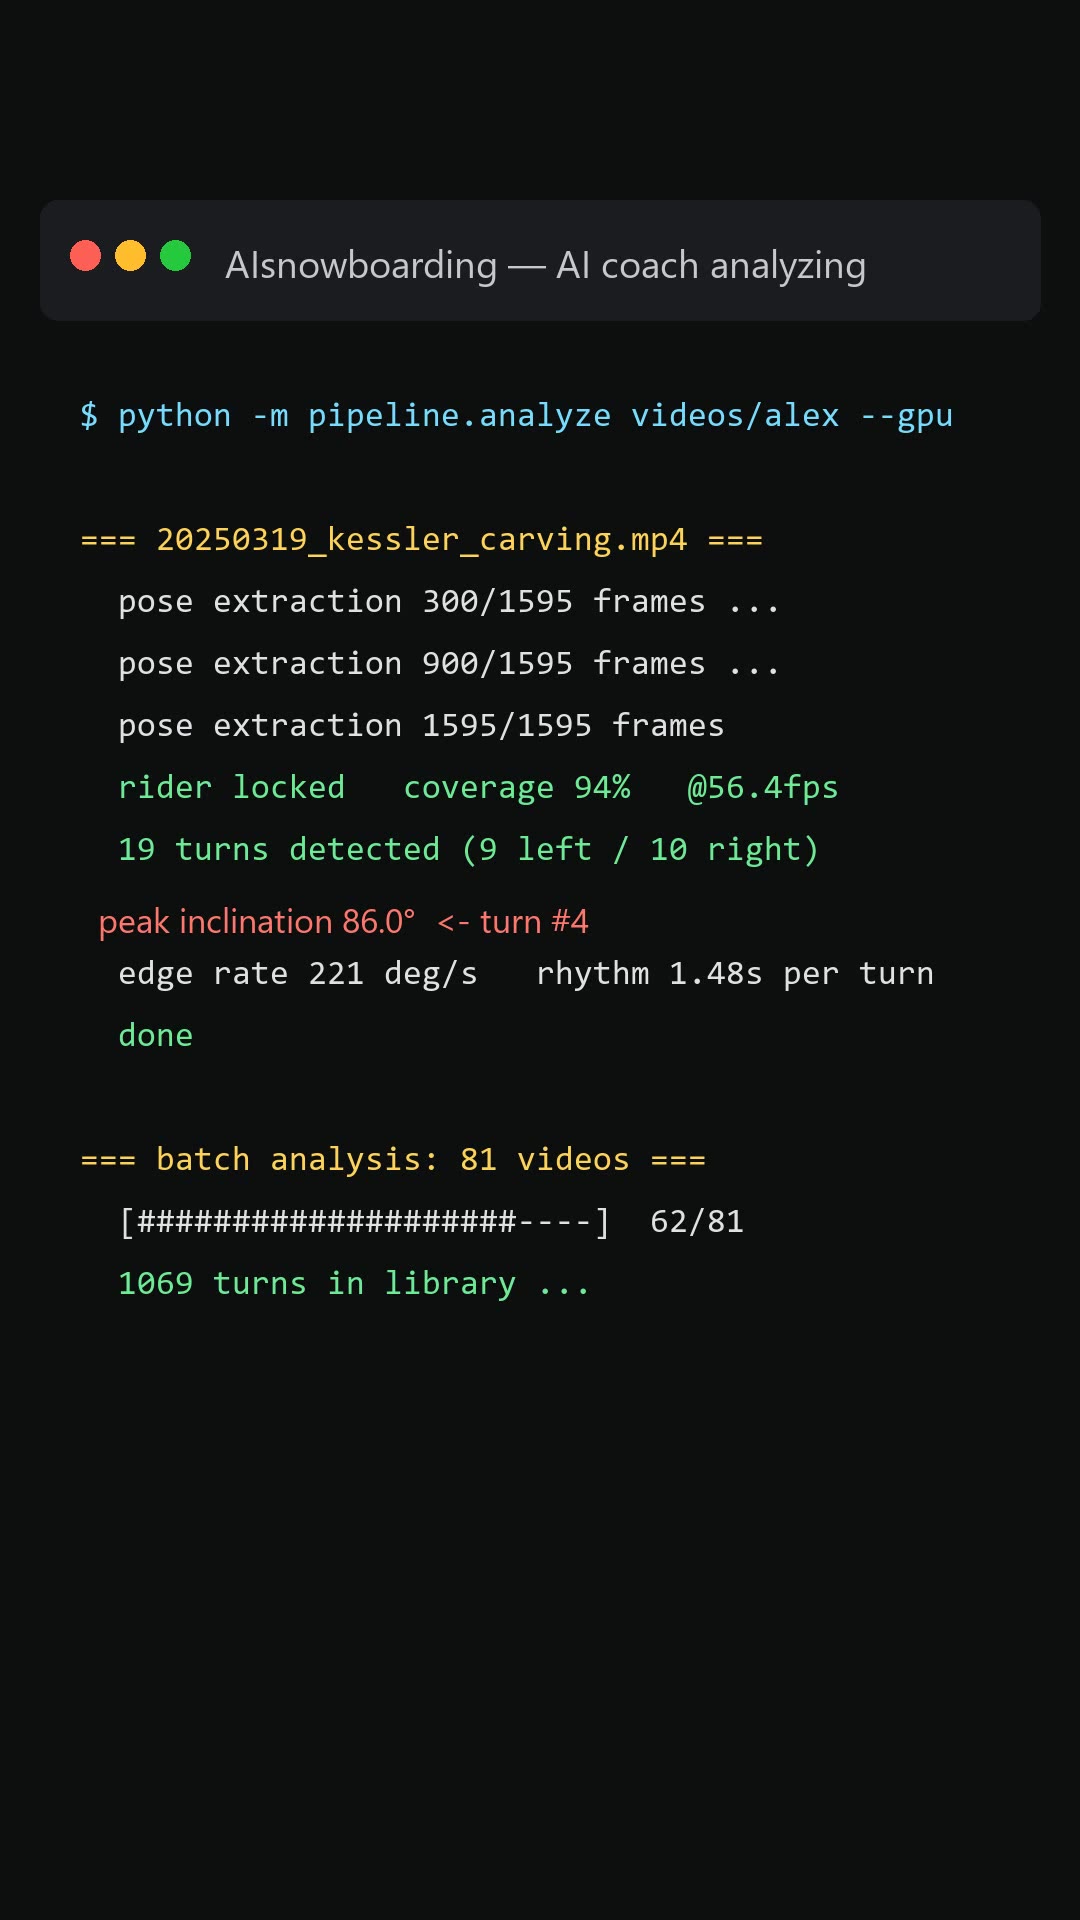
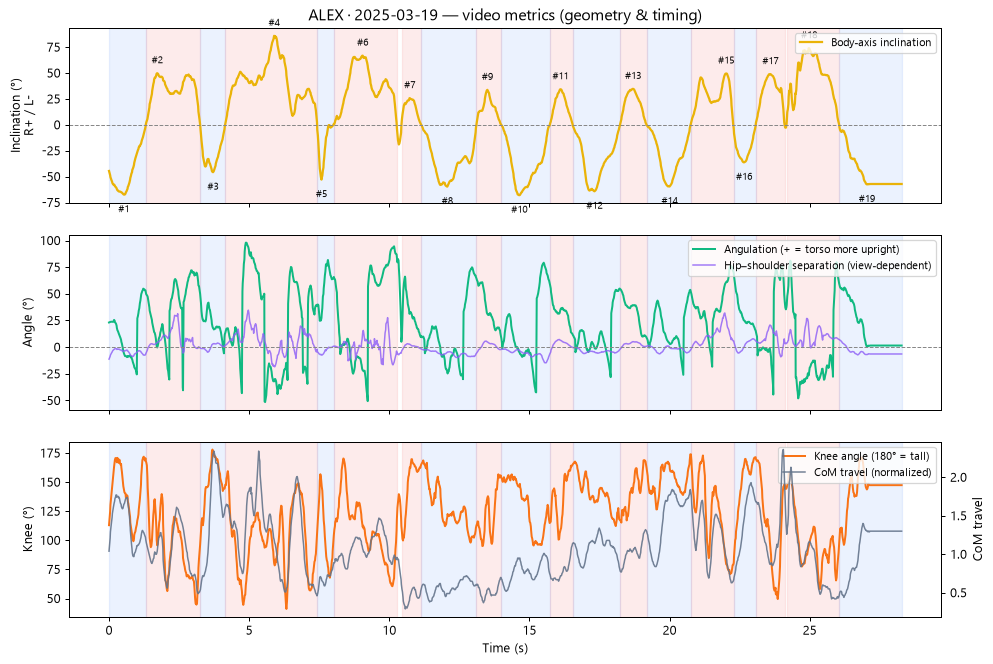
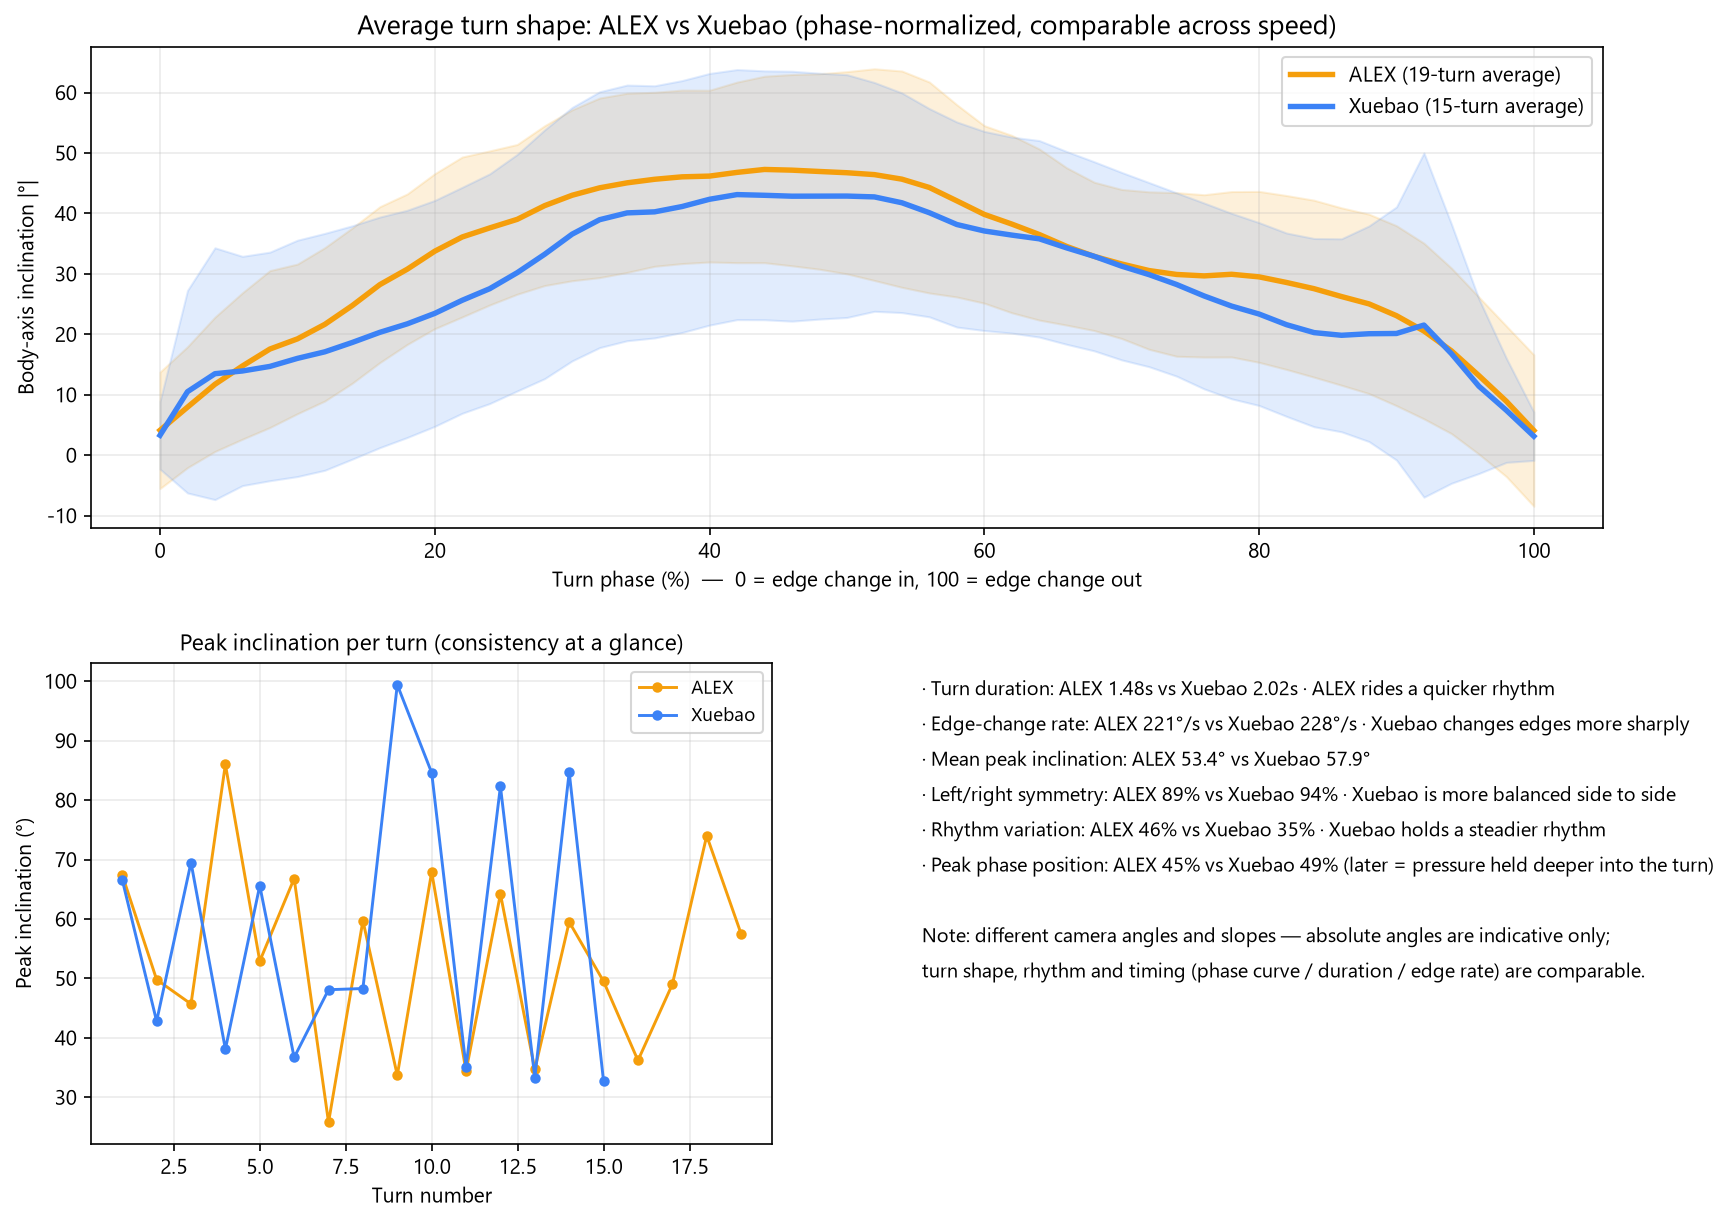
Everything below is genuine pipeline output; the rider is the founder. All 156 runs live in the library.
Per-turn data: 19 turns in this run (hover or tap)
–
Bar height = peak inclinationLeft turnsRight turns
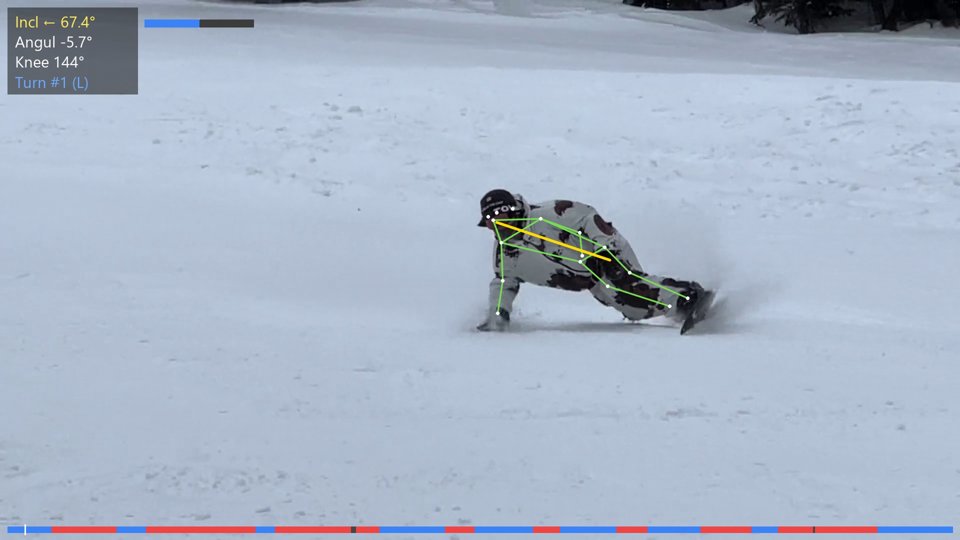
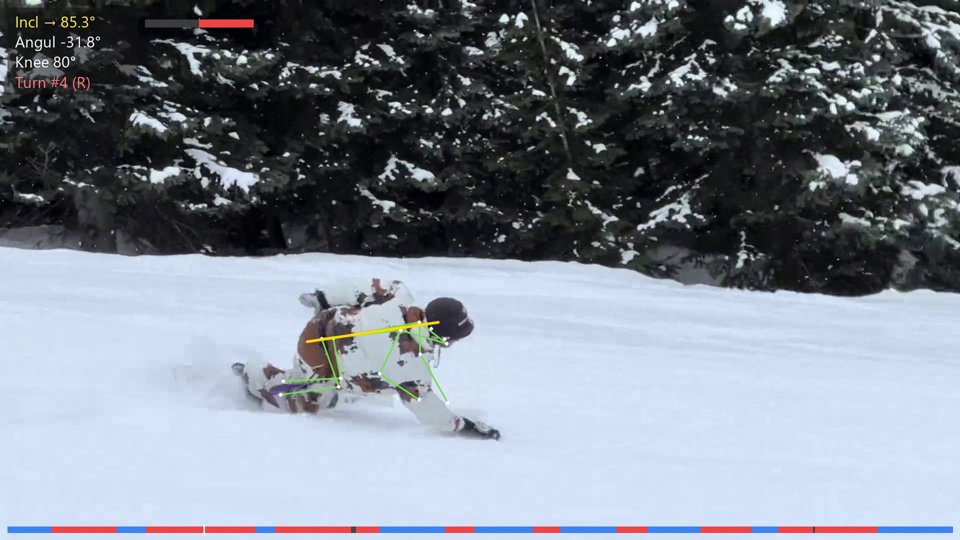
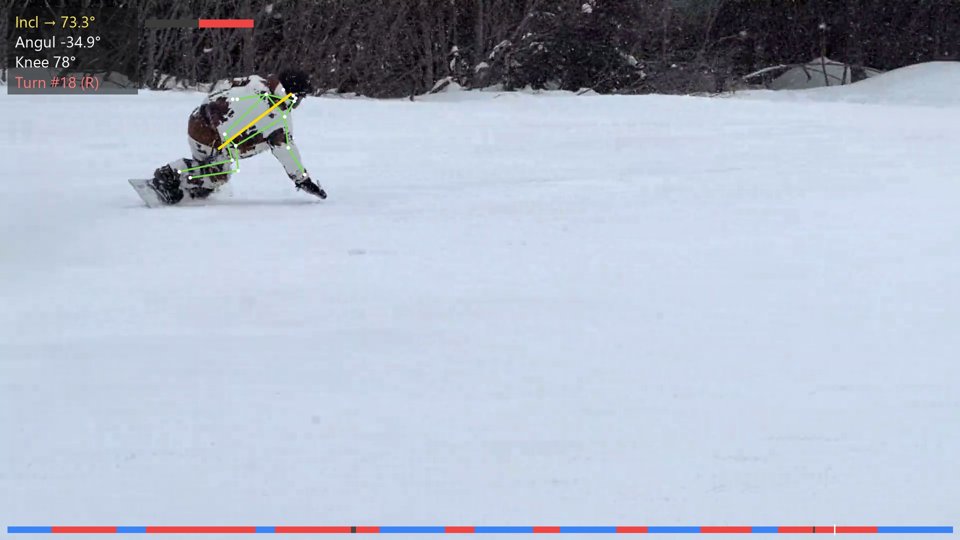
Peak moments are captured and annotated automatically — not one of these frames was made by hand.